Plots and images#
image converter is very useful tool to quickly inspect simulation results.
It accepts data with any 1-D and 2-D scoring grid and is producing images in PNG format with plots.
Conversion is done using standard command:
convertmc image --many "*.bdo"
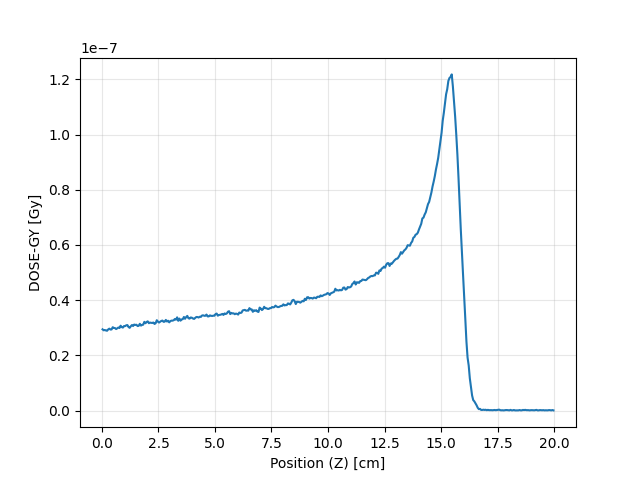
After converting data with 1-D scoring grid, following plot can be generated:
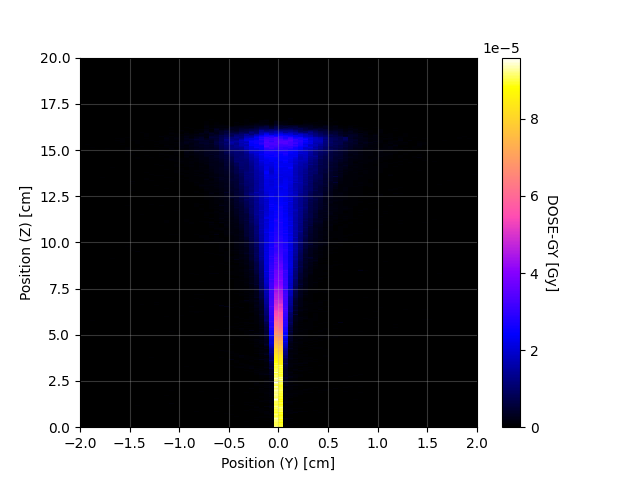
Data containing 2-D scoring grid are visualised as heatmap with color denoting scored value.
Options#
Logarithmic scale#
User can also set logscale on one or more axis in the plots using –log option.
An example plot with logarithmic scale on Y axis:
convertmc image --many "*.bdo" --log y

Scale can be also change on two axis at once:
convertmc image --many "*.bdo" --log x y

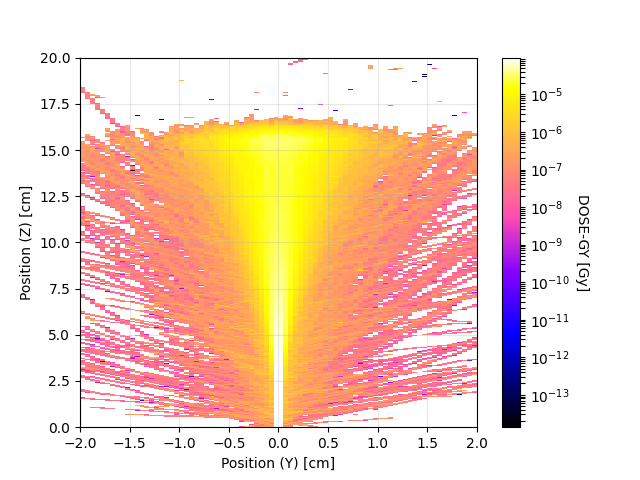
An example plot with 2-D heatmap and logarithmic scale on Z (color) axis:
convertmc image --many "*.bdo" --log z
Colormap#
When generating 2D heatmaps it is also possible to specify colormap. List of available colormaps is available here: https://matplotlib.org/stable/tutorials/colors/colormaps.html. By default colormap called gnuplot2 is used. An example plot obtained with other colormap (Greys) can be obtained with following command:
convertmc image --many "*.bdo" --colormap Greys
